
June markets balanced US-Iran peace hopes, lower oil prices and renewed risk appetite as the S&P 500 ended slightly lower
A busy month for the markets in June
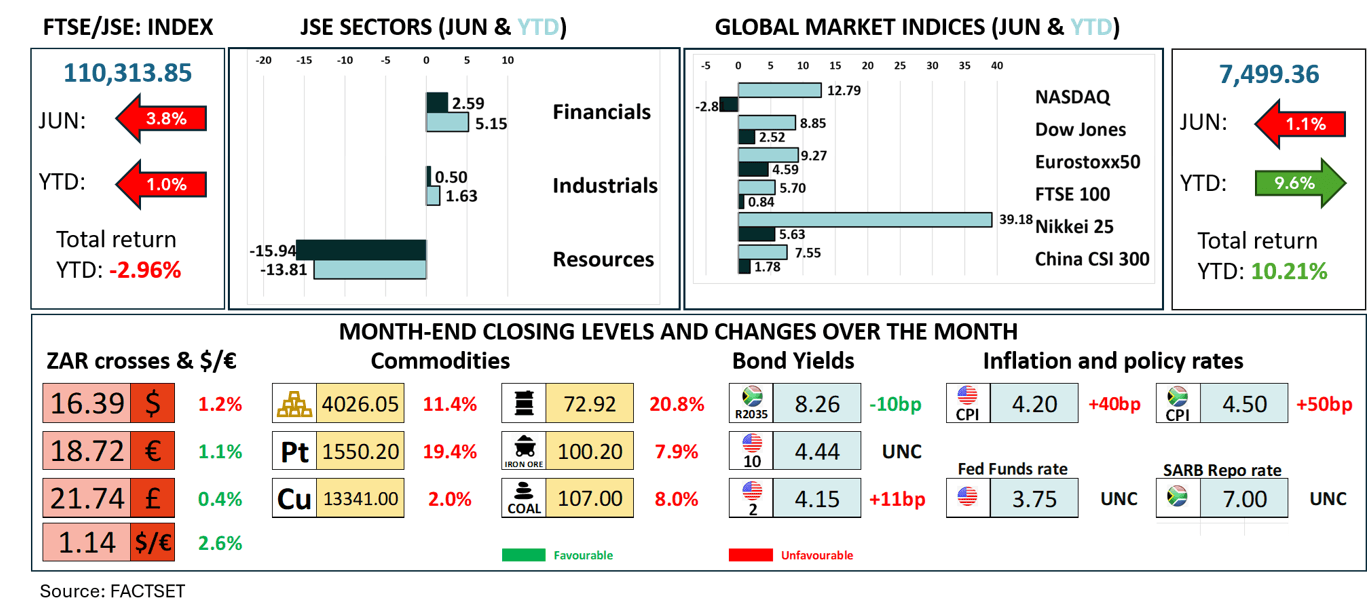
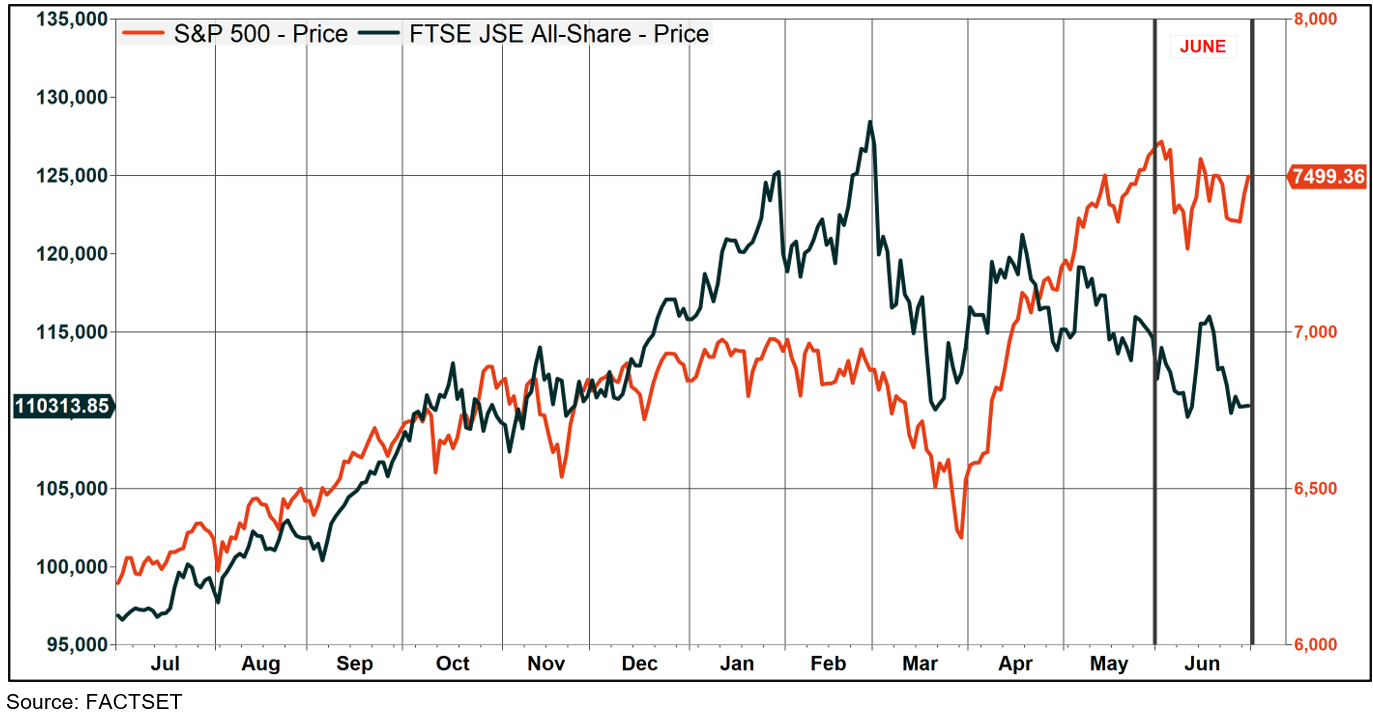
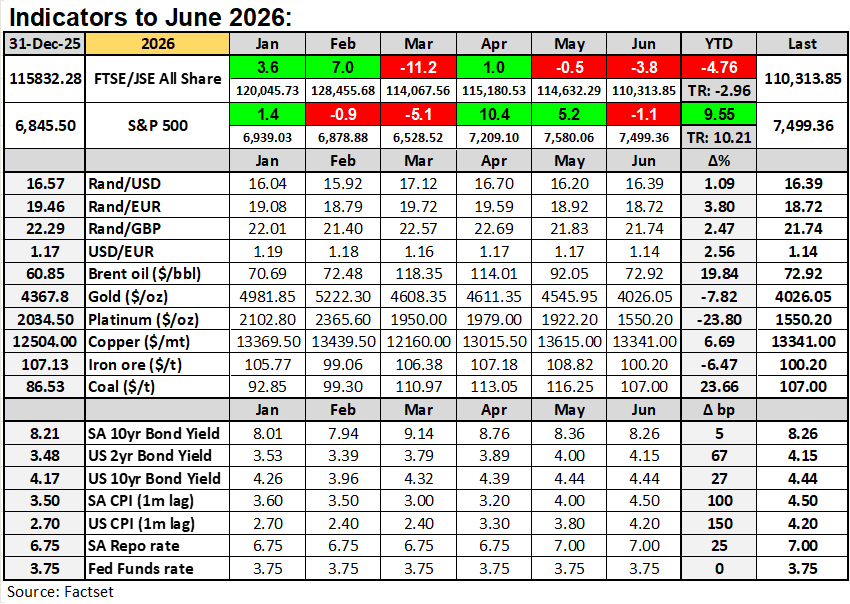
The markets had an abundance of news to digest during June with the defining moment being the signing of the US-Iran memorandum of understanding (“MOU”) that paused the conflict between the two countries and provided hope of a more permanent peace deal being struck. The Strait of Hormuz was opened up to maritime traffic and goods and oil began flowing again. The hope of a lasting peace brought a “risk-on” approach back to the markets, which were further buoyed by the price of oil dropping by 20% over the month. Over the course of May and into early June, the US markets moved higher, as investors ignored the conflict and pinned their hopes on a deal being struck. The S&P 500 set a new all-time record on the 2nd of June (7,609.78 pts) before falling back again as an agreement failed to materialise. The markets rallied briefly once an MOU was signed but the S&P 500 failed to regain its early-June peak and closed the month 1.1% lower at an index level of 7,499.36 (see the chart of the S&P 500 of the past year below).
The prospect of peace was welcomed by the markets but the conflict and the high oil prices, which had lasted for the better part of three months, had already exacted a toll. Producer prices had risen as energy costs surged and the primary and secondary effects had already filtered through into consumer prices. The South African Reserve Bank hiked its policy rate in May at the first sight of second-round inflation effects while the European Central Bank hiked rates in June, Europe’s first rate hike since 2023. The euro strengthened as rates were increased but although the US Federal Reserve kept rates unchanged at their June meeting, the Fed’s hawkish tone and the prospect of higher rates in 2026 helped the dollar to strengthen once more. The greenback started the month at $1.15/€, depreciated to $1.18/€ before appreciating again to $1.13/€ towards month-end. The June meeting of the Federal Reserve Open Market Committee was the first for the new chairman Kevin Warsh. There was much speculation ahead of Warsh’s appointment whether his blood ran hawkish or dovish but his approach towards managing monetary policy and the Fed’s rate-setting committee was not in question. Warsh had made it well known that he was vehemently opposed to using the Federal Reserve’s balance sheet for monetary policy purposes and he was also not in favour of providing forward guidance on interest rate decisions. Christine Lagarde, governor of the ECB, has said the same about her institution, promising that monetary policy will be enacted through interest rates and not balance sheet management, cheap loans to banks and forward guidance.
As a consequence of the higher oil prices, the increased inflationary pressures and the expectations of tighter monetary policy to come, the prospects for global economic growth dimmed. In the World Bank’s “Global Economic Prospects” report released in June, forecasts for global growth in 2026 were cut to 2.5%, the lowest rate of global growth since the COVID pandemic. The forecasts of 2.8% growth for each of 2027 and 2028 remain below the 2.9% growth achieved in both 2024 and 2025 and equivalent to the 2.8% growth achieved in 2023. Overall, the World Bank’s latest estimates highlight the negative impact of the war on a global economy already in a state of stagnation. While oil prices have fallen right back to where they started before the onset of the conflict, it will still take time to be felt positively in consumer inflation rates, economic growth rates and central bank policy rates. Any favourable outcome remains predicated on the MOU being converted into a lasting peace deal.
FTSE/JSE All Share index (black, LHS) and S&P 500 (vermillion, RHS): One year (daily)
After all of the hype and euphoria around SpaceX, Anthropic and OpenAI making their way to the markets, SpaceX led the way with its listing in June at a market capitalisation of over $2 trillion. SpaceX’s initial public offering (“IPO”) price of $135 per share was quickly surpassed on listing and the share traded up to $201 in its first days on the market before closing out the month at $170.86. The listing of SpaceX was seen as one reason for the weakness in other areas of the market, particularly in technology, software, chipmakers and communication services stocks, where some of the big winners of the recent past were sold off to fund take-ups of the SpaceX IPO. The sectors that underperformed the S&P 500’s 1.1% decline in June included Communication Services (-7.86%), Energy (-5.14%), Consumer Discretionary (-4.78%) and Technology (-3.33%). The sectors that outperformed the index in the month included Industrials (+7.19%), Healthcare (+6.46%), Financials (+4.22%), Utilities (+2.44%), Real Estate (+0.23%), Consumer Staples (+0.17%) and Materials (-0.14%). At the halfway point of the year, the S&P 500 index was up 9.6% with a total return of 10.2% when including dividends.
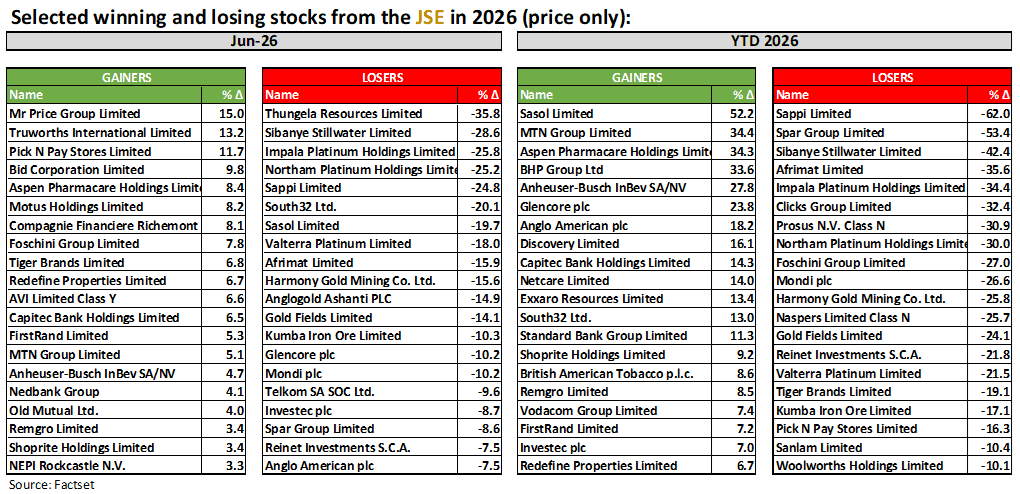
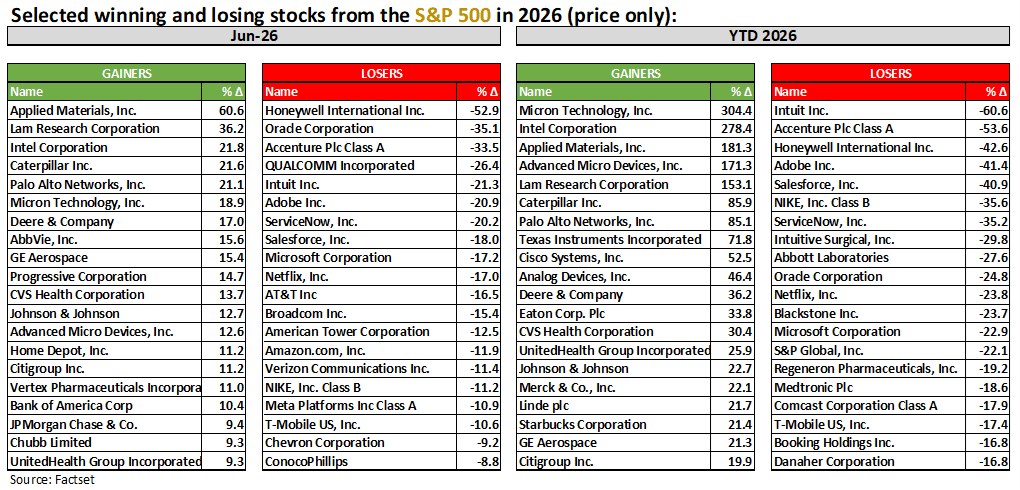
On the JSE, Financials managed a 2.6% gain and Industrials added a half of a percent but it was the lower commodities prices that hurt most. Precious metals, base metals and the bulk commodities all traded lower over the course of June. Gold gave up 11%, platinum lost 19%, copper declined by 2% and iron ore and coal both slipped by 8%. That was in addition to the 20% decline in the oil price. The precious metals-heavy Resources index declined by 15.9% in the month to leave the FTSE/JSE All Share index down 3.8% in June. That decline saw the JSE slip further into negative territory with a return of -4.8% for the year so far. After accounting for dividends, the total loss for the first six months of the year reduced to 3.0% - see the list of individual stock gainers and losers on the JSE and the S&P 500 in June and for the year-to-date in the tables below.
To pivot or not to pivot
The question for households, investors, borrowers, economists, central bankers and others, is where to from here? Will the MOU be converted into a permanent peace deal? Will oil prices stay low or even move lower with a surplus of oil in a low-demand global economy? Will inflation recede and allow central bankers to resume easing monetary policy through lower interest rates? Will there be a lagged negative impact on corporate earnings growth from the conflict effects that we have experienced over the past three to four months?
The market could react negatively at any time should geopolitical conditions deteriorate but current market expectations are for a peaceful deal to be reached between the US and Iran, which would keep oil prices at their lower levels. The lower cost of energy would reduce input costs to production and consumer prices would benefit both directly and indirectly from lower fuel costs. Central banks would not respond positively immediately but would likely hold interest rates at current levels through the course of this year to manage inflation expectations (lower) and to make sure that the worst had passed. In time, the South African Reserve Bank will have have scope to reverse the recent rate hike and resume some modest rate-cutting. That would be welcomed by an economy struggling to grow at a pace much faster than 1%. We’re unlikely to get any forward guidance from the ECB or the Federal Reserve but the Fed, at least, would be in a position to ease rates a little in the new year. The new Fed governor has stressed that the inflation target in the US is 2% and that any outcome above that is unacceptable. That firm tone could keep rates where they are for now until inflation actually starts falling and inflation expectations are anchored closer to 2%. The market could handle “higher for longer” rates if the prospect for the next move is downward.
Supportive of the US market is the strong growth of corporate earnings. The second quarter earnings reporting season gets underway in mid-July with expectations of 22% earnings growth year-on-year from revenue growth of 12.1%. For the remaining quarters of 2026 and for the calendar year as a whole, earnings growth in the early twenties is expected. With a forward price/earnings ratio of 21.6x, the market can’t be considered expensive, even if it is trading one standard deviation above its 10-year mean. The market hasn’t been rising because of increasing valuations but rather from solid underlying earnings and profitability growth and from productivity gains. Continued earnings growth should support further gains in the market. Global markets would feed off stronger US markets but exchange rates and local conditions would provide variability to individual exchanges. The FTSE/JSE All Share index is resources-heavy and very dependent on the fortunes of the precious metals miners along with the big banks and insurers and a handful of dual-listed multinational companies. Overall, earnings growth expectations remain in double digits with a modest market valuation that reflects some promise that the JSE can turn its first half negative return into a positive return for the year.
Appendix:

Craig Pheiffer

Market and Economic Commentary: January 2026
The party plates from the New Year’s Eve party were hardly washed and packed away when the level of geopolitical craziness in the world was ratcheted up a notch.
Read more